NewOct 26, 2026
Add Flitch and your dashboards to your Android or Apple home screen
Flitch and every published dashboard now install as an app on Android and iPhone, with their own icon and no browser bar. There is no app store and nothing to download, and a dashboard installs under its own name and icon.
View details→
Oct 8, 2026
Flitch in Indonesian and Spanish
The app and flitch.io now read in Bahasa Indonesia and Spanish, and everything the AI writes follows the language you choose. Pick one from the footer of any page, and it is kept across every Flitch site and, when you are signed in, on your profile.
View details→
Sep 29, 2026
Workflows now available
A workflow is a set of steps that runs over your data: read it, reshape it, have AI read or decide, then save the result, email it or send it on. Run one by hand, on a schedule, when your data changes, or from a button on a dashboard. Every run is recorded.
View details→
Sep 29, 2026
Edit text on the page, and layout checks by the AI
Click any text on a dashboard to change it, without a prompt. The AI can also check its own layout at phone, tablet and desktop width and fix what it finds.
View details→
Sep 28, 2026
Chat: ask about your data and make changes from one place
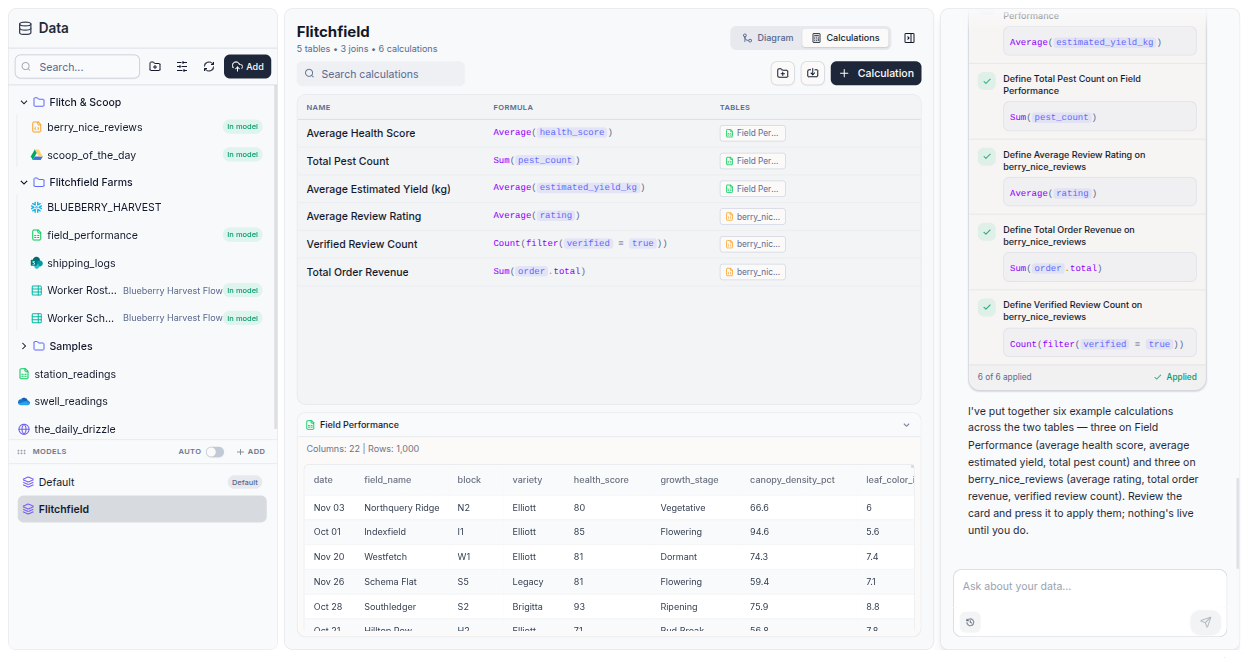
Chat is at the top of the sidebar. Ask questions about your data, then have it build a dashboard, fix a table, define a calculation or set up a workflow. Every change is shown as a card for you to apply.
View details→
Sep 28, 2026
Build reports and apps as well as dashboards
Create now builds three kinds: a dashboard, a written report, or an app people enter data into. Pick one, or leave it on Auto and it picks from your request.
View details→
Sep 28, 2026
Input tables edit like a spreadsheet
Tables people fill in on a dashboard now use the same grid as the Data tab: click a cell and type, paste, sort and add rows.
View details→
Sep 15, 2026
Ask AI keeps the conversation, and can draw
The chat on a published dashboard now remembers each reader, works across every dataset behind the dashboard, and answers with a chart when a chart is the answer.
View details→
Sep 15, 2026
PostHog
Chart what your product is doing beside what your business is doing: events, sessions and exceptions, read from the tool that already holds them.
View details→
Sep 10, 2026
Your own AI provider account, on Enterprise
If your company already has an account with Anthropic, OpenAI or Google, Flitch can run on it instead of on credits.
View details→
Sep 8, 2026
Ask the next thing without waiting for the last one
An edit takes as long as it takes, and the thought you had while watching it used to have to wait with you. Write it anyway: it queues behind the run and goes out the moment the current turn finishes.
View details→
Sep 6, 2026
Choose the model, in each of the four places Flitch uses one
Creating a dashboard, editing it, asking about your data and answering the people you publish to are four different jobs, and they no longer have to run on the same model. Pick per job, from Anthropic, OpenAI, Google and xAI.
View details→
Sep 1, 2026
Viewers, and one dashboard that shows each of them their own rows
Somebody who only reads is now a role rather than a seat you pay for, and a dataset can filter itself to whoever is looking. One dashboard, one link, and each person sees the rows that are theirs.
View details→
Aug 31, 2026
Business: many teams, one bill
A business sits above your teams and holds the things that should be settled in one place: who is billed, which credits they share, how people sign in, and what everyone did. The plans are simpler underneath it, because Team has folded into Pro.
View details→
Aug 20, 2026
Models: agree on your numbers
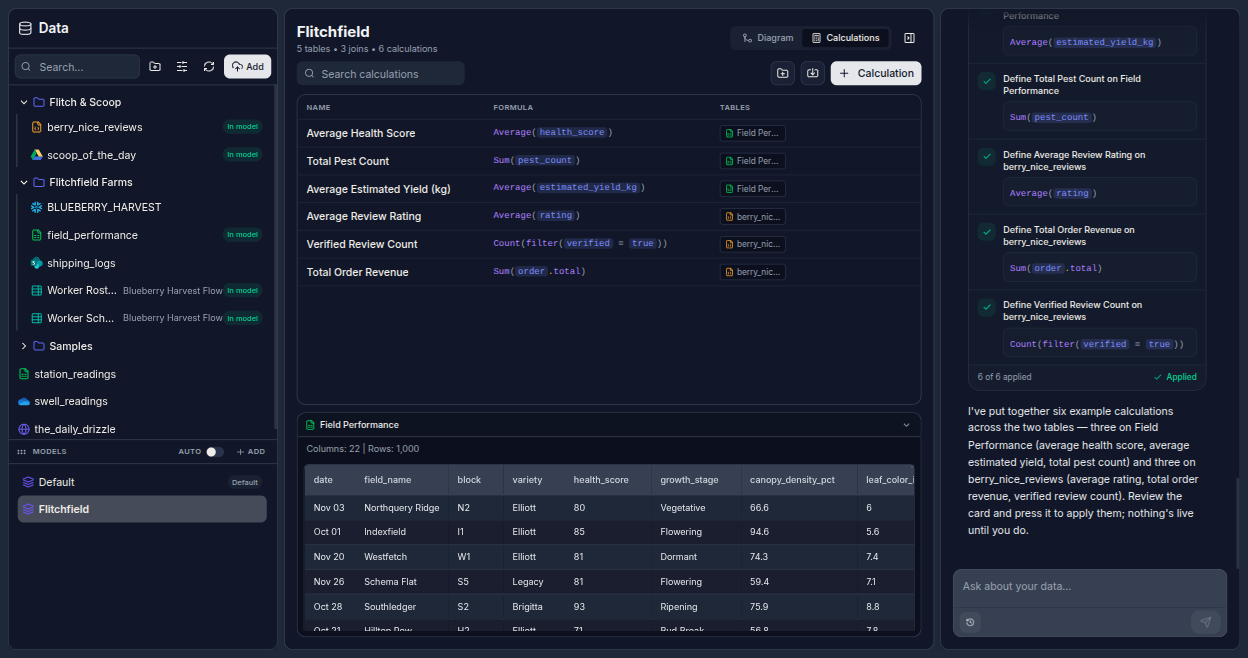
Two dashboards built a week apart can both be reasonable and still disagree. A model is where your space settles how its tables relate and what its named figures mean, so every dashboard reading it works the same number out.
View details→
Aug 14, 2026
Chart Flitch itself
Every other source tells you about your business. This one tells you about your Flitch: who reads what you publish, what is quietly failing, and where the spend goes.
View details→
Aug 12, 2026
Build your own things on your Flitch data
Your data and your dashboards are now reachable from your own applications over plain HTTPS, so what you have connected to Flitch is not only usable inside Flitch.
View details→
Aug 11, 2026
An analyst in your data library
Ask questions of everything you have connected and get answers from the actual rows, then act on what you find without leaving the panel.
View details→
Aug 11, 2026
Dashboards that collect data, not just read it
Some of what a dashboard needs has no source to connect. Describe what you want to track and it is built with the entry built in, so the people who know can fill it in.
View details→
Jul 22, 2026
Upload more files at once, and replace data in place
Bring several files in together, choose which sheets to keep, and swap the file behind a dataset without losing what is built on it.
View details→
Jul 21, 2026
GeoJSON data sources and richer maps
GeoJSON is now a data source in its own right, and maps have the controls to make use of it.
View details→
Jul 15, 2026
Manual edits become restore points
Changes you make by hand in the inspector are now saved as versions you can browse and restore, alongside AI edits.
View details→
Jul 7, 2026
New quick ways to add data
Start a dashboard from more than a connection: find a public API with AI, pull from a URL, extract a file, or type, paste, or generate data on the spot.
View details→
Jul 7, 2026
Ask AI on published dashboards
Let viewers ask questions of a published dashboard and get answers from its data.
View details→
Jul 7, 2026
Scheduled reports and embeds
Email a dashboard on a schedule, or add it to any site with an embed snippet.
View details→
Jul 7, 2026
Custom domains
Serve a published dashboard on your own domain instead of a Flitch link.
View details→
Jul 7, 2026
Control who can see a published dashboard
Keep a dashboard public, or restrict it with a password, sign-in, or specific email addresses.
View details→
Jun 24, 2026
Over 20 new integrations
A big expansion of read-only data sources across CRM, finance, marketing, support, productivity, dev tools, and wearables.
View details→
Jun 24, 2026
Connect your databases: PostgreSQL, MySQL, SQL Server, and MongoDB
Point Flitch at your own databases with read-only credentials and build dashboards on your tables.
View details→
Jun 17, 2026
Faster dashboard previews
Opening a dashboard again and making edits is quicker, with less waiting between changes.
View details→
Jun 16, 2026
Maps from GeoJSON
Build polygon and choropleth maps from your own GeoJSON, for regions, territories, and custom boundaries.
View details→
Jun 10, 2026
Webhooks, custom APIs, and Kraken
Three more ways to bring data into Flitch: receive live webhooks, connect any REST API, and pull read-only data from Kraken.
View details→
Jun 3, 2026
New data sources: HubSpot, OData, and MyGeotab
Three more ways to bring data into Flitch: HubSpot CRM, any OData v4 service, and the MyGeotab fleet API.
View details→
Jun 2, 2026
Live data refresh
Published dashboards and the editor preview now update in place when your data changes, with no reload.
View details→
May 26, 2026
Documentation site
A full documentation site at docs.flitch.io, with step-by-step guides for every data source and feature.
View details→
May 18, 2026
Sync schema from data warehouses
Pull foreign keys, table descriptions, and column descriptions directly from your warehouse into Flitch, so the data model stays in step with what is actually deployed.
View details→
May 15, 2026
Brand kit for AI generation
Set your brand and every new dashboard picks it up automatically. Choose a built-in preset, save your own theme, or upload a logo, and the AI applies it across palette, radius, font, and navigation chrome.
View details→
May 5, 2026
Export dashboards as PDF, PNG, or PowerPoint
Download a published dashboard as a multi-page PDF, a PNG (or zip of PNGs), or a PowerPoint deck, straight from the publish popover or the publishing settings tab.
View details→
Apr 28, 2026
JSON, XML, and more upload formats
Upload structured data files directly: JSON, XML, and other text-based formats now join CSV and Excel as supported uploads.
View details→
Apr 22, 2026
AI context for teams and dashboards
Give the AI freeform background on your business, data, or terminology so edits respect your context.
View details→
Apr 21, 2026
Web search in AI edits
The AI can now search the web while editing your dashboard, pulling in current information without leaving the chat.
View details→
Apr 17, 2026
Export charts and tables
Right-click any chart or table to copy or export it directly from the dashboard.
View details→
Apr 16, 2026
Flitch is live
After 10 months of building, testing and iterating, Flitch is officially launched and open to everyone! 🎉
Apr 6, 2026
External testing complete
10 testers over 6 weeks. 206 issues raised and resolved, with an average rating of 4.4/5.
View details→
Apr 4, 2026
Update cancellation
Cancel in-progress AI edits at any time without waiting for completion.
View details→
Apr 2, 2026
Per-dataset refresh controls
Configure refresh schedules individually for each dataset instead of at the connection level.
View details→
Apr 1, 2026
Subscription renewal emails
Automated email notifications when your subscription renews, with billing details.
View details→
Mar 30, 2026
Row-Level Security
Enterprise-grade data isolation enforced at the database level across all tables and API routes.
View details→
Mar 29, 2026
Version history and restore
Browse and restore previous versions of your dashboard from the menu dropdown.
View details→
Mar 27, 2026
Data tab calculations
Edit formulas, number formatting, and conditional formatting directly in the data tab without AI.
View details→
Mar 27, 2026
Design inspector editing
Edit themes, text, styles, and chart types directly in the design inspector without AI.
View details→
Mar 27, 2026
36 chart types and variants
17 core chart types and 19 variants, from bar and line charts to treemaps, sankey diagrams, and heatmaps.
View details→
Mar 27, 2026
Smarter AI communication
AI updates now show clear progress indicators and produce more concise output.
View details→
Mar 26, 2026
Databricks integration
Connect to Databricks SQL warehouses as a data source for your dashboards.
View details→
Mar 22, 2026
Billing and team subscriptions
Team-level billing, automatic tax handling, and improved subscription management.
View details→
Mar 20, 2026
Onboarding tour and in-app support
Guided tour for new users, contextual tooltips, and a support widget built into the app.
View details→
Mar 20, 2026
Chart cross-filtering
Click any chart element to filter all other charts on the same page interactively.
View details→
Mar 19, 2026
Team management
Team settings page with role-based access control, invitations, and member management.
View details→
Mar 19, 2026
Mobile improvements
Better mobile experience across the dashboard editor, settings, and navigation.
View details→
Mar 18, 2026
Published dashboard badges
Live data refresh status displayed directly on published dashboards.
View details→
Mar 18, 2026
Dashboard analytics
Track view counts and usage patterns for your published dashboards.
View details→
Mar 17, 2026
Security hardening
API route security audit, rate limiting, and improved SSO authentication.
View details→
Mar 12, 2026
60% faster preview loads
Dashboard previews now load in ~12 seconds, down from ~30 seconds.
View details→
Mar 4, 2026
Attachments and project assets
Upload images, logos, and files to use in your dashboards. Assets persist across edits.
View details→
Feb 23, 2026
Dashboard access control
Granular permissions and OAuth ownership checks for all dashboard operations.
View details→
Feb 19, 2026
AI editing overhaul
Major upgrade to the AI editing system with better context management and more reliable updates.
View details→
Feb 4, 2026
Testing started
First public testing phase begins. Share your feedback at [email protected] to help shape the product.
View details→


 ODataCalendlyJiraPostHogFrom URLSharePointDatabricksCockroachDBAzure Database
 MyGeotabXeroConfluence
 monday.comUpload & extractCSV / ExcelPostgreSQLRedshiftAzure SQL
 KrakenPipedriveNotionShopifyGenerate dataJSON / XMLMySQLTimescaleDBMongoDB
 AirtableStravaCustom REST APIMariaDBAmazon RDSMongoDB AtlasWebhooksIntercom